The way that wind interacts with urban environments can determine the comfort and amenity of not just building occupiers but also the people within the public realm and open space areas.
A balanced approach is required to ensure that wind resources within an urban precinct are not inappropriately deterred or focused to allow buildings to be naturally ventilated and public realm areas to be enjoyed in all seasons.
Testing the implications of certain design controls and the impacts of development applications within a specific precinct can provide critical insights when undertaking future planning for an area. Specifically, the size, orientation, setback and height of building structures proposed through development applications may impact on many buildings within the locality.
Understanding the extent of wind resources available to a specific development site can also allow designers to capture prevailing breezes and significantly reduce the reliance on air conditioning and lessen associated environmental impacts.
Wind flows can be difficult to understand without the application of fluid dynamic simulations. Early conceptual modelling can be undertaken quickly to provide key insights for government agencies, designers, developers and decision makers.
This article is not intended to be a step by step guide to completing the outlined analysis. Rather it is intended to be an introduction to key matters which relate to wind analysis and how AKL FlowDesigner processes this information. Detailed instructions, tutorial videos and copies of all sample files can be downloaded by Registered Customers here.
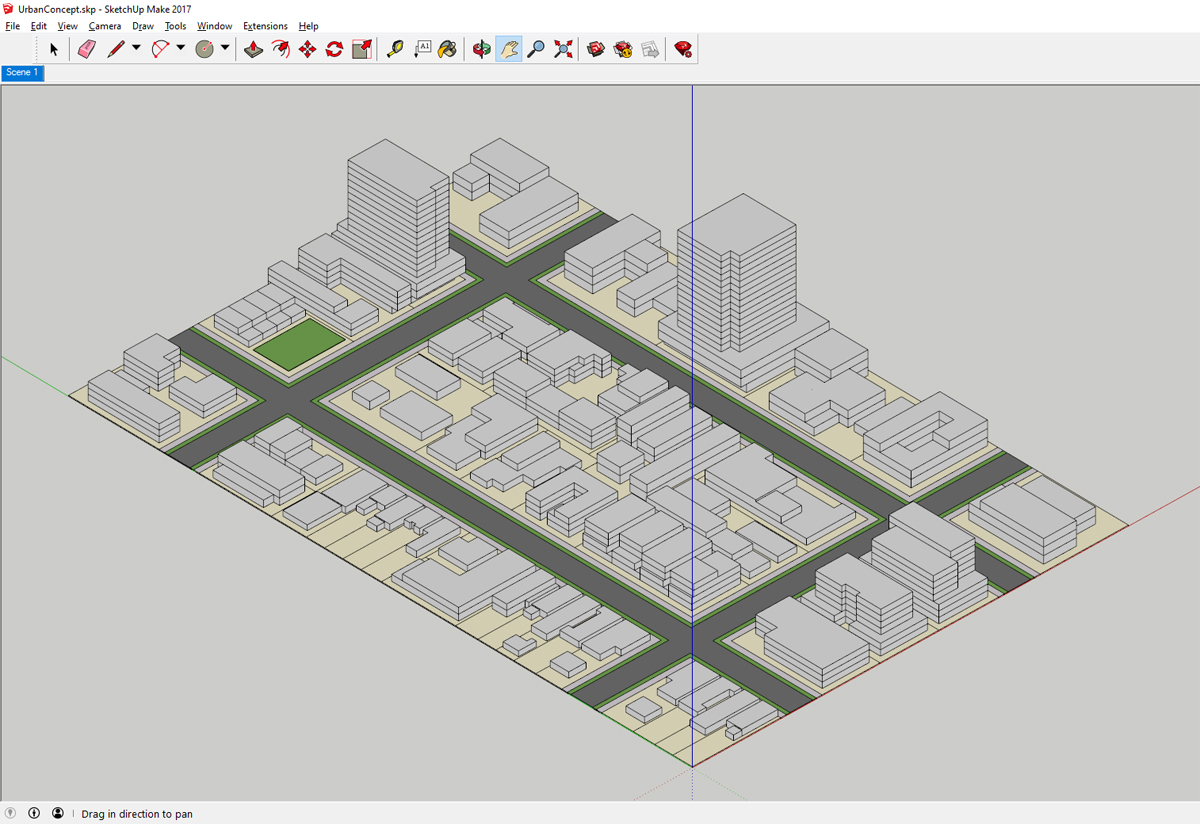
Developing a massing model of an urban area which reflects the existing built form can provide a good understanding of the spatial relationship between buildings and structures. Programs like Trimble SketchUp®, can provide a quick and easy way of representing urban elements including existing, proposed, and under construction development projects. The below image shows a hypothetical 'existing' urban environment which has been modeled in SketchUp®. The key elements included in the model are streets, footpaths, land parcels and built form massings. Given that this is a high level analysis, details regarding roof structures, glazing, materials, facade design and vegetation have not been included. Importing an urban context model like the one below into AKL FlowDesigner is a intuitive and simple process. This is because the program provides direct import support for SketchUp® files (SKPs).
Whilst there are numerous variables which can be tested, the most important for cross ventilation and wind analysis are wind speed, wind direction, observed height, temperature and relative humidity. This information can be readily found on a number of websites including www.nathers.gov.au, www.bom.gov.au, www.accuweather.com, which include a broad set of weather details.
If local weather information isn't available there are a number of ways in which this data can be collected for a specific location. Compact weather stations can be deployed to any area of interest to capture key information including wind speed, direct, temperature, solar energy etc. Weather stations vary in terms of sophistication meeting the needs of many groups from weather enthusiasts to university research teams.
Specifically, the number, type and accuracy of a weather station as well as how it transmits and stores data will inform the price of the system. Many stations can send observed information to the internet. Wundermap is a webpage which collects this information and publishes in almost real-time online. It may be possible to access information through services such as these from sources closer to a project site. However caution should be applied when relying on this data as it is only as good as the user who maintains the station.
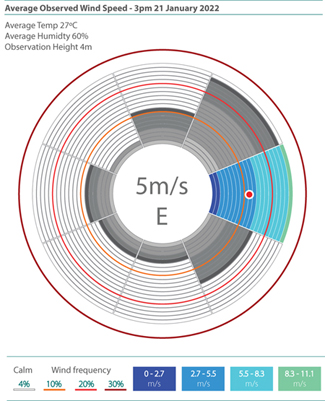
The example used for this article will apply a theoretical wind environment with wind speed and direction shown in the wind rose diagram to the left. The average temperature and relative humidity of the time of day is also noted. Whilst its important to understand the full seasonal impact of a local weather system, this example focuses on a typical summer afternoon (3pm, 21 January) to see how breezes may be interact with the built form.
For more information on how to interpret wind roses please see the following link to the Australian Bureau of Meteorology.
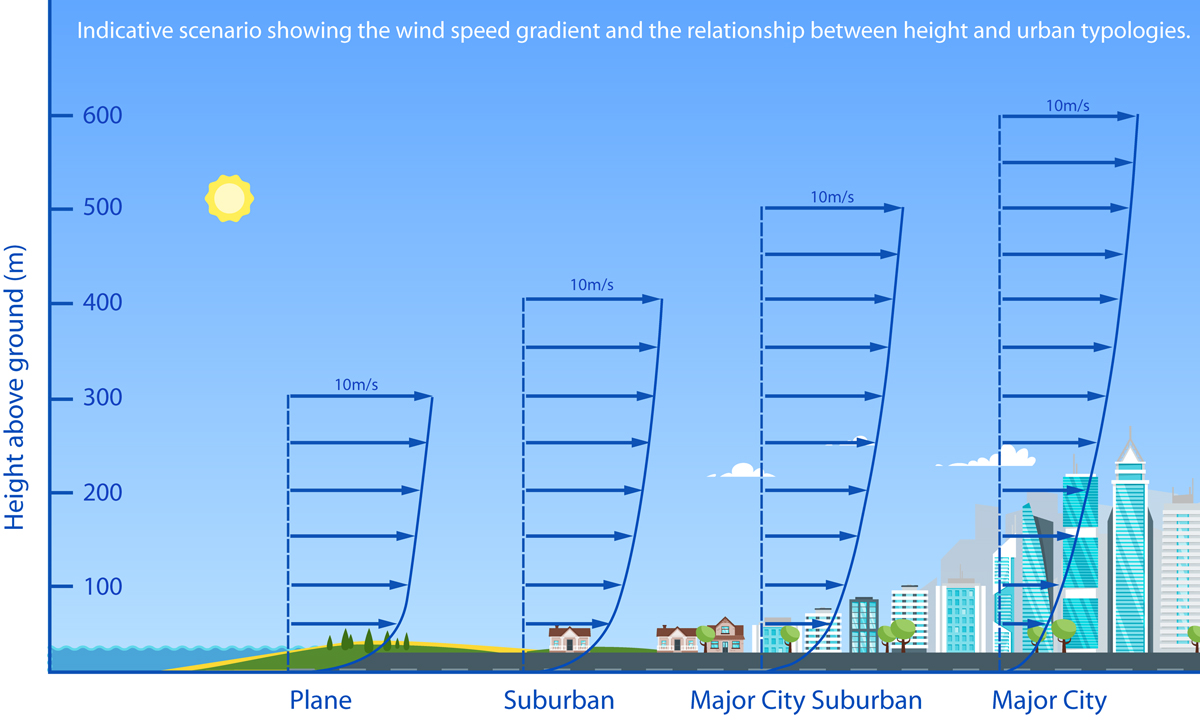
Where possible, it is also important to identify the height at which the wind information was recorded. This is because wind increases in speed the higher it is above the ground. The type of terrain and intensity and height of development can also influence the speed profile of wind. The relationship between these factors is not linear but rather follow a curve sometimes referred to as the Wind Speed Gradient. Whilst there are a number of other ways to describe this phenomena, the diagram to the left is representative of the theory and has been accurately accounted for in AKL FlowDesigner.
More information regarding the science behind the behavior of wind in different urban settings may be found here. The Australian Bureau of Meteorology includes this information with their wind roses as 'elevation' data. This should therefore be included as the 'Observation Point Height' in AKL FlowDesigner.
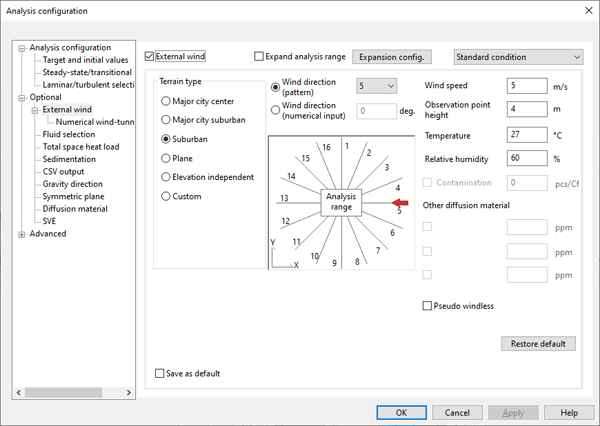
By applying the weather information discussed above, environmental simulations can be performed to determine the direction and speed of incoming winds and how the urban environment impacts on these wind resources. The below 'Configuration' dialogue box from AKL FlowDesigner shows the primary inputs which can be easily adjusted for each a simulation.
In addition to the above, the initial conditions for the simulation need to be set within the same configuration dialogue under 'Target and Initial Values'. These simply include the current conditions of day in terms of temperature and humidity. AKL FlowDesigner offers many different ways to import information and configure simulations. This particular analysis is intended to only give results for one specific time of day but the software is capable of completing transitional analysis which accounts for changes in wind directions and speeds throughout the day.
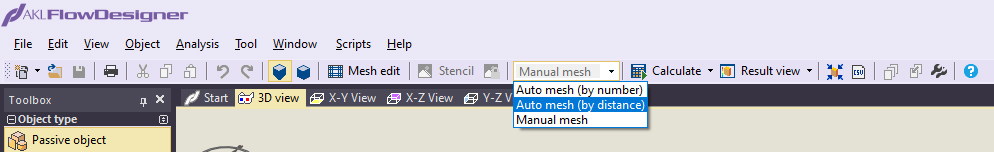
The resolution or size of the analysis 'mesh' or 'grid' determines the degree of accuracy applied to each simulation. It also influences how long each simulation takes to complete. For broad areas like the one used in this example it may be appropriate to apply a 1 metre wide mesh to the model. The process of 'meshing' a design is particularly important when details regarding windows, doors, vegetation need to be considered. These approaches including tips and techniques will be discussed in future articles, but are not necessary to consider for this example. See below the most efficient way to input mesh parameters.
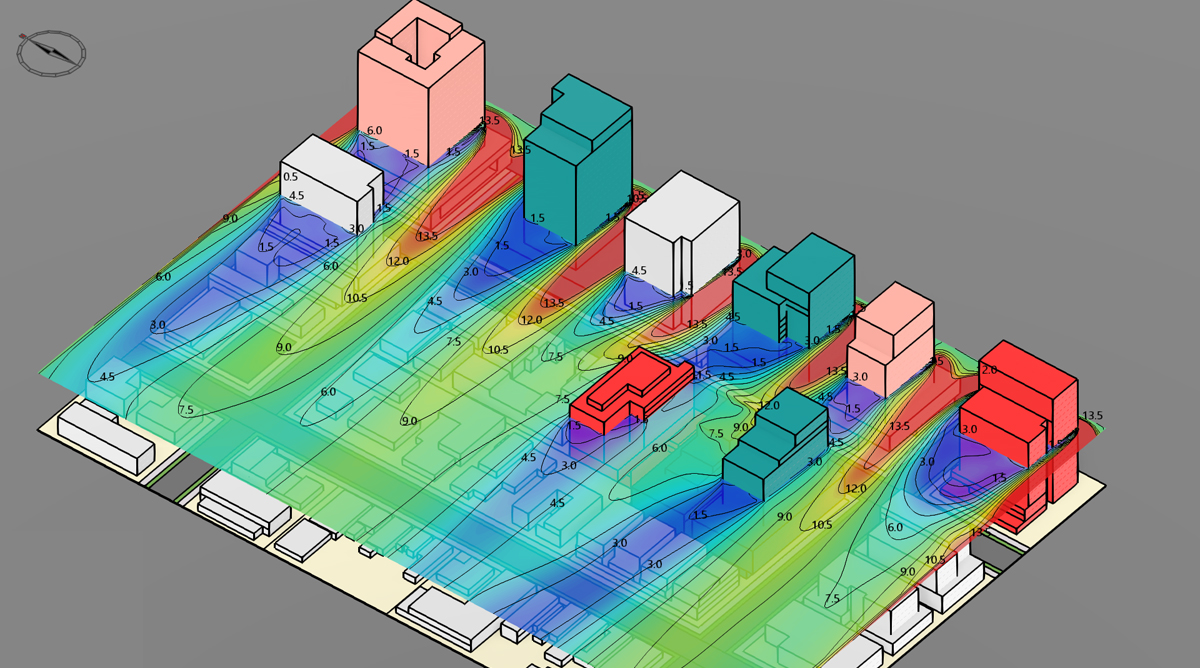
Once the above details are confirmed and the simulation has completed, the Results View provides a range of opportunities to inspect the outcomes from the analysis. The below images shows three separate horizontal cross sections each at varying heights identifying the direction and speed of wind within the system. The incoming wind speed here is based on the summer morning observations which contain a 5m/s breeze observed at 4m above ground originating from the East.
Click on the images below to see the high resolution version.
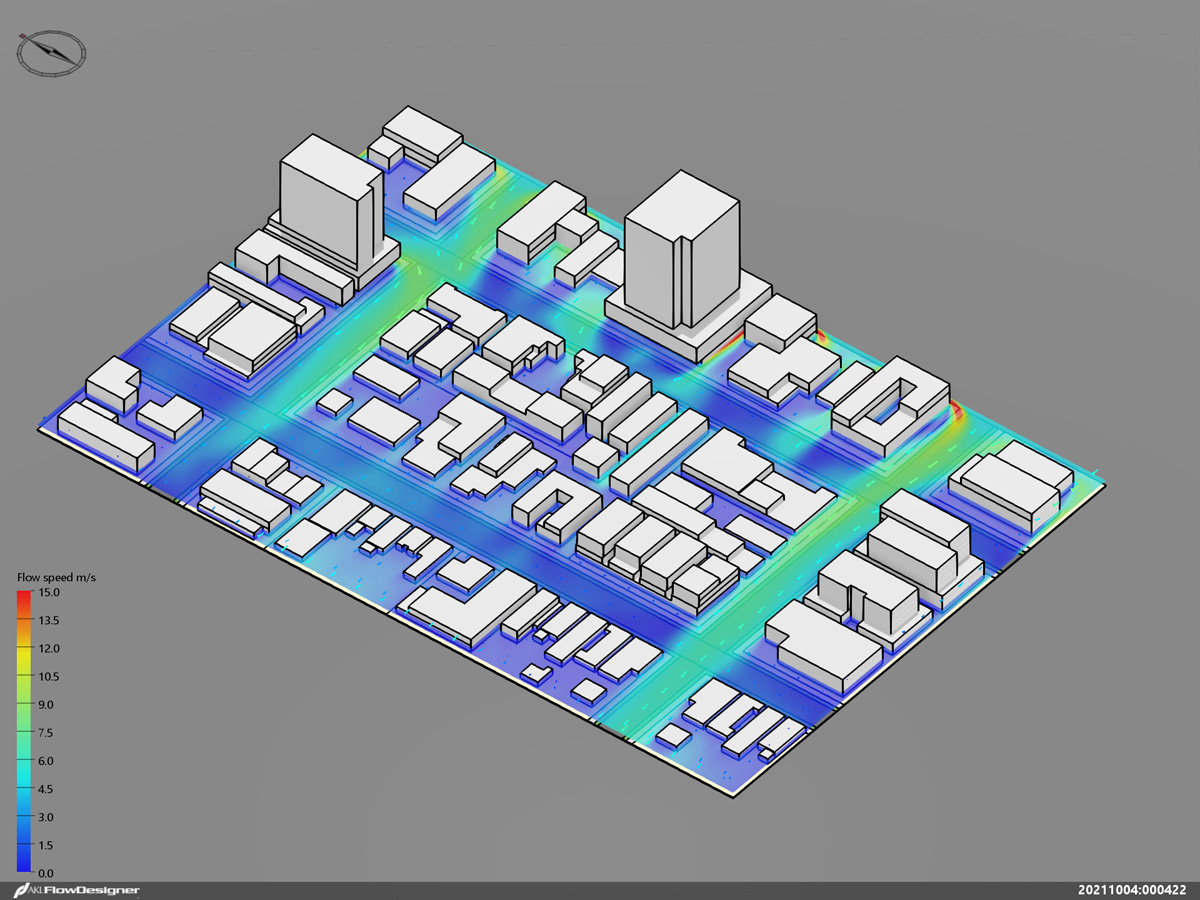
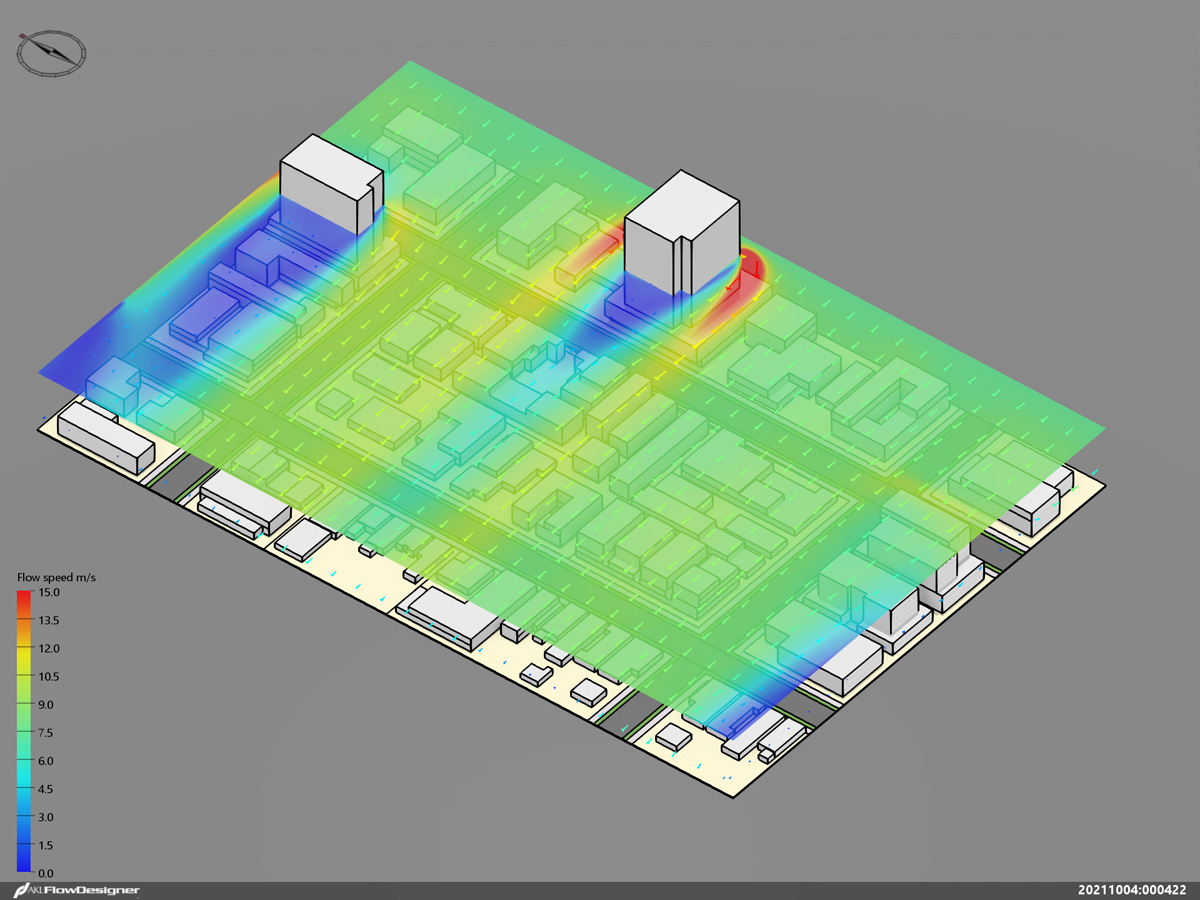
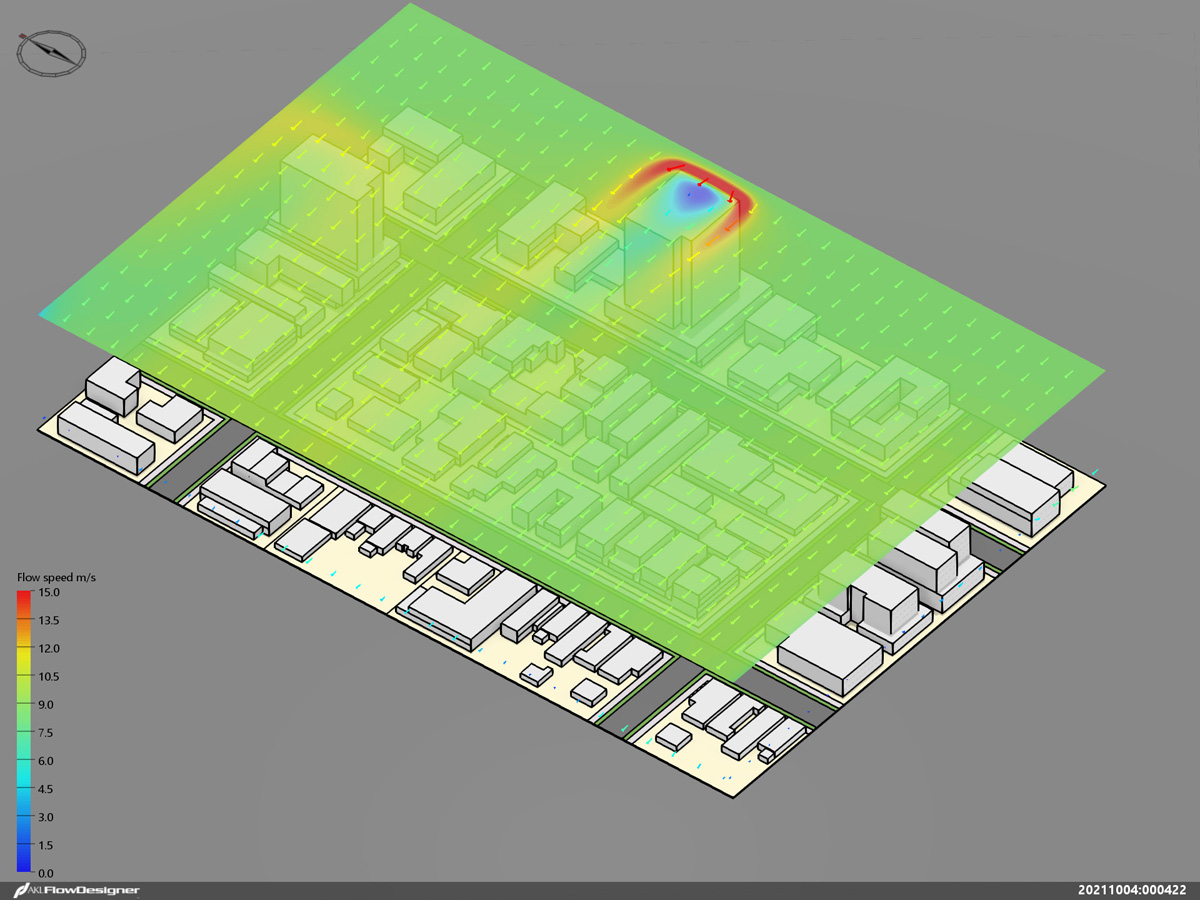
The above images show how the prevailing wind is impeded and re-directed at ground level. The higher elevations are largely unimpeded except for around the high rise forms. It is worth noting that the length and prominence of the ‘wind shadow’ cast from each of these structures varies based on their location within the system, their orientation / volume as well as the flows established by surrounding buildings.
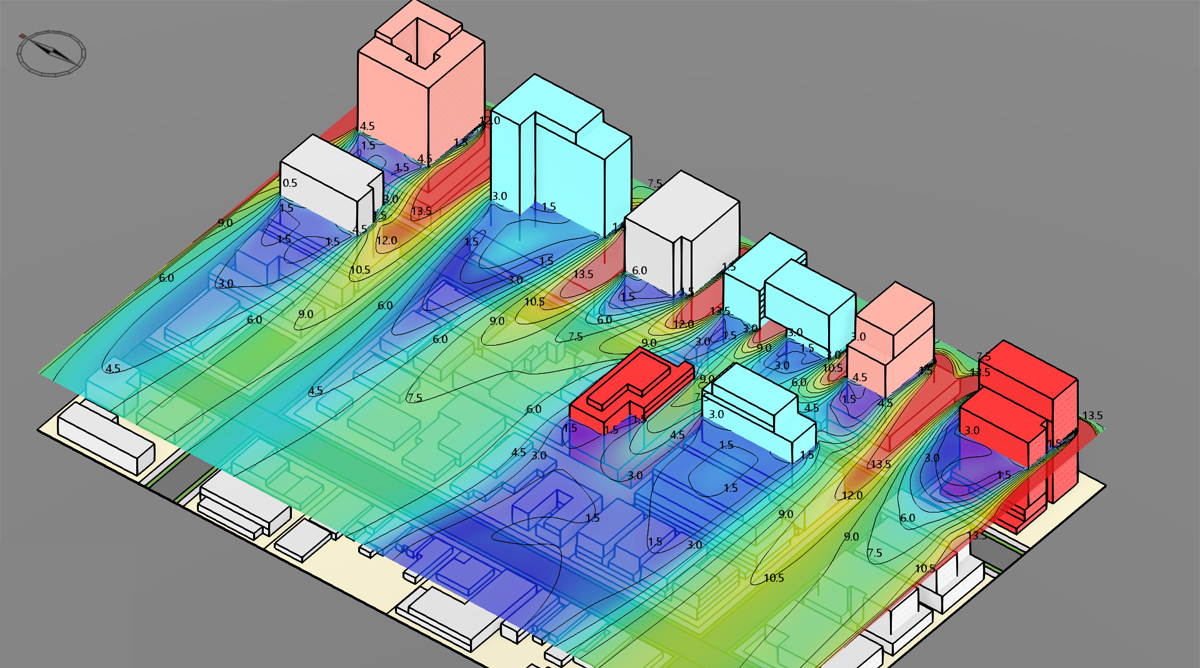
In addition to preparing the existing built form within a SketchUp®model, it is useful to develop forms which represent the known and potential future projects occurring within the area. The below image shows the same urban context area but now includes proposed developments, approved development, under construction builds and public realm areas. AKL FlowDesigner is capable of importing multiple groups, elements and layers from SketchUp®.
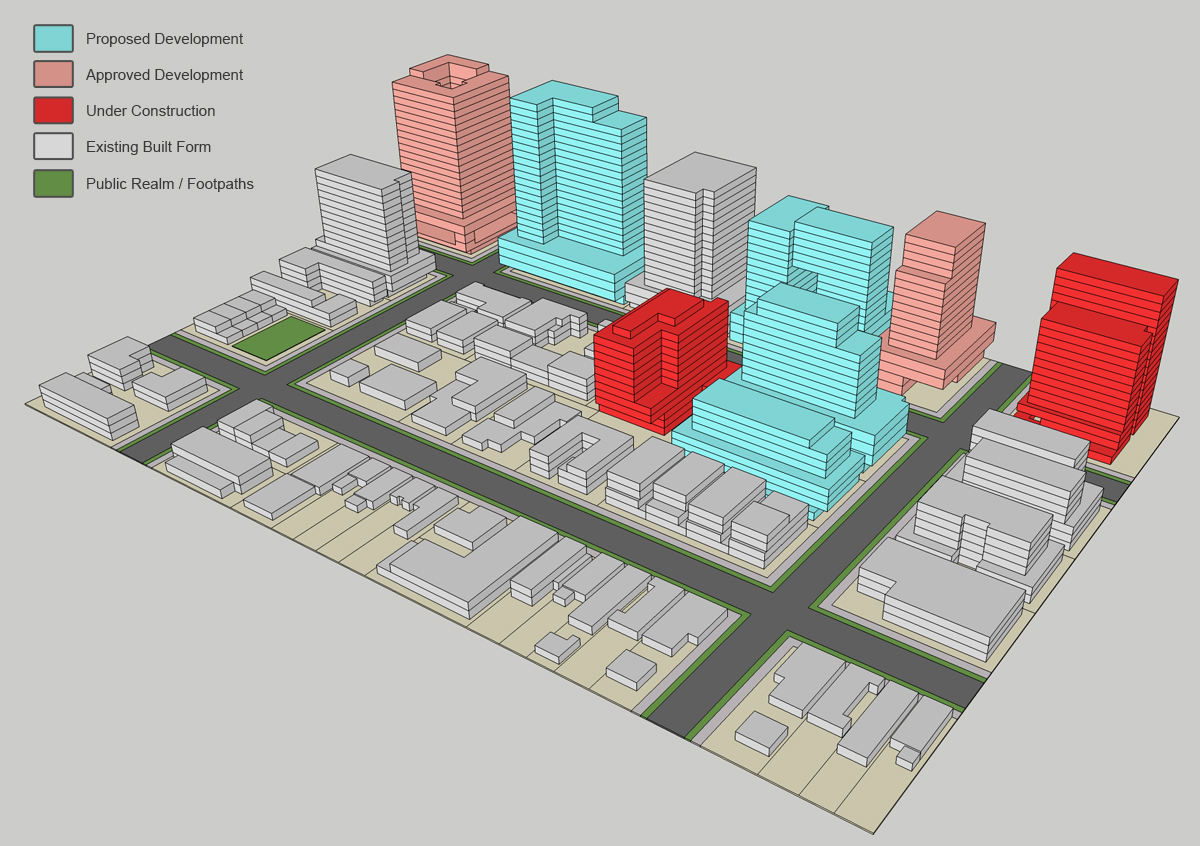
FlowDesigner can be used to inform decisions at any stage of the design, planning and approvals process however for this example, the 'proposed development' will be the focus of the analysis. By simply disabling or enabling content individual development components can be turned on or off to determine their impact on the precinct.
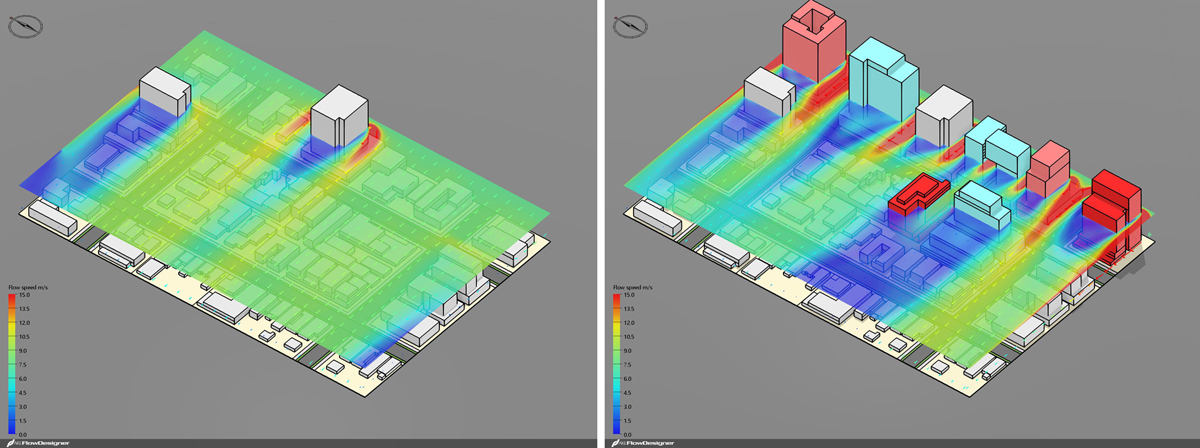
For example, when comparing the original analysis for existing structure against a scenario with new development details, the difference between the two scenarios can be quickly understood.
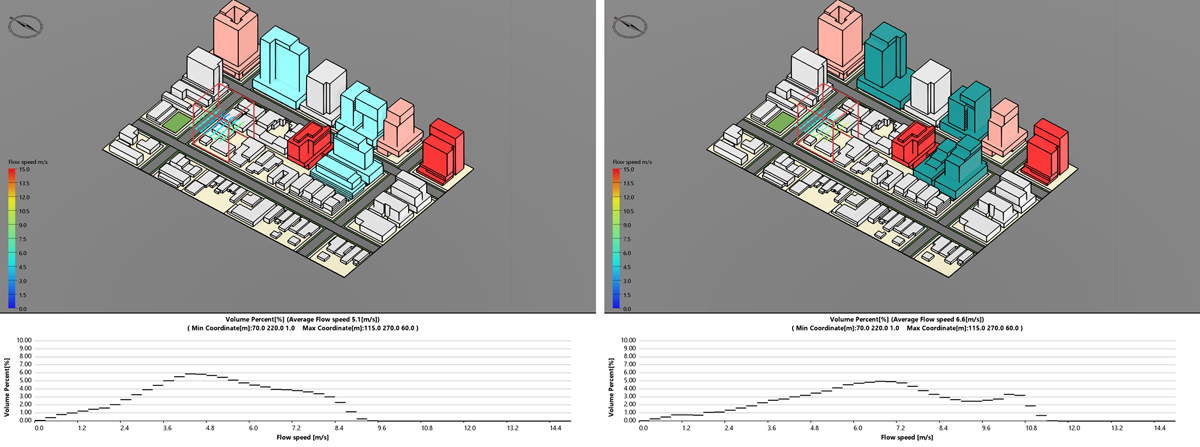
The specific impact of each proposed development can be examined and the advantages of alternative design responses can be measured. By re-orientating the proposed built form and applying different setbacks the value of planning controls and the impact of a proposed development can be understood. The diagram below illustrates two different approaches to built form design. Whilst matters such as activation, human scale, view lines and visual enclosure need to be considered the following shows just two examples of how the same building footprint can be achieved on a site.
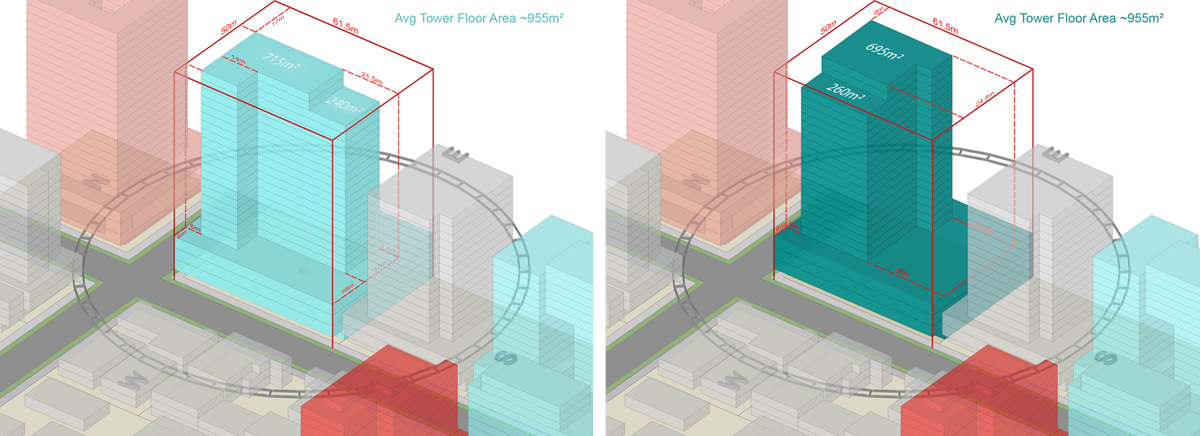
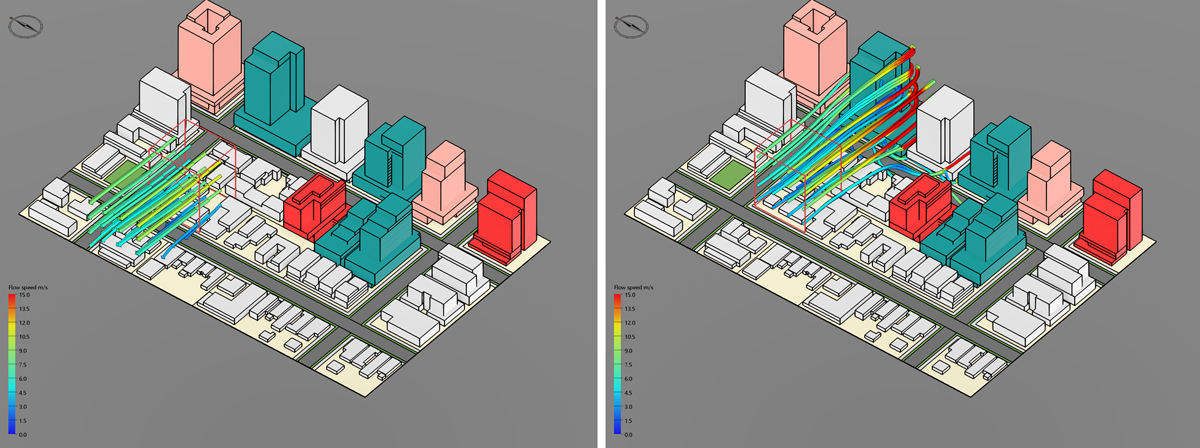
The below example illustrates the affect that the above changes to orientation and setbacks have on the available wind resource. The image slider shows how the available breezes downwind of the structures have increased significantly in terms velocity and extent of areas which receive increase airflow.
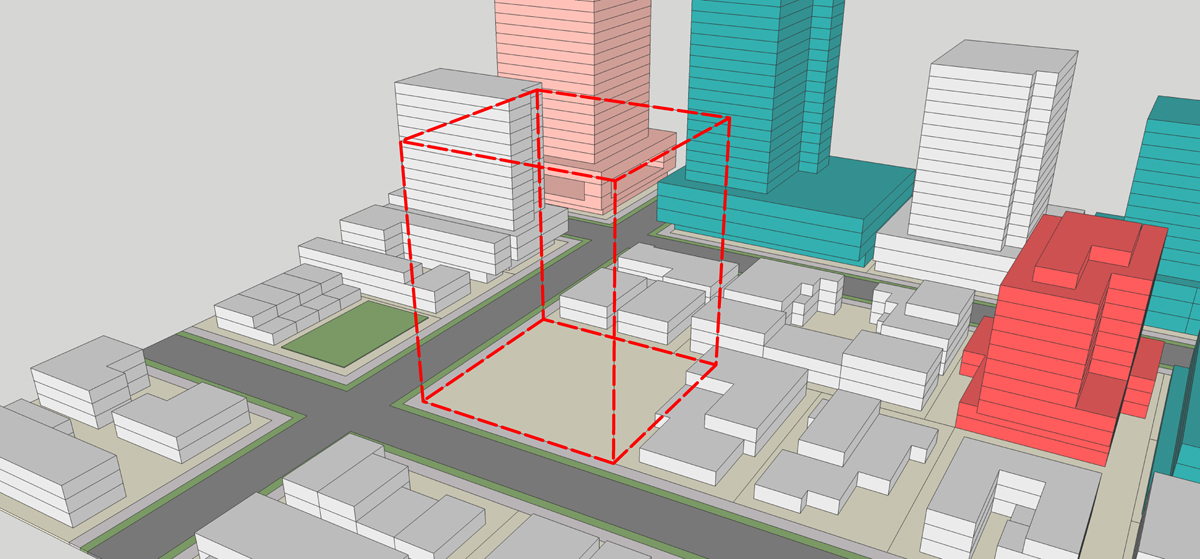
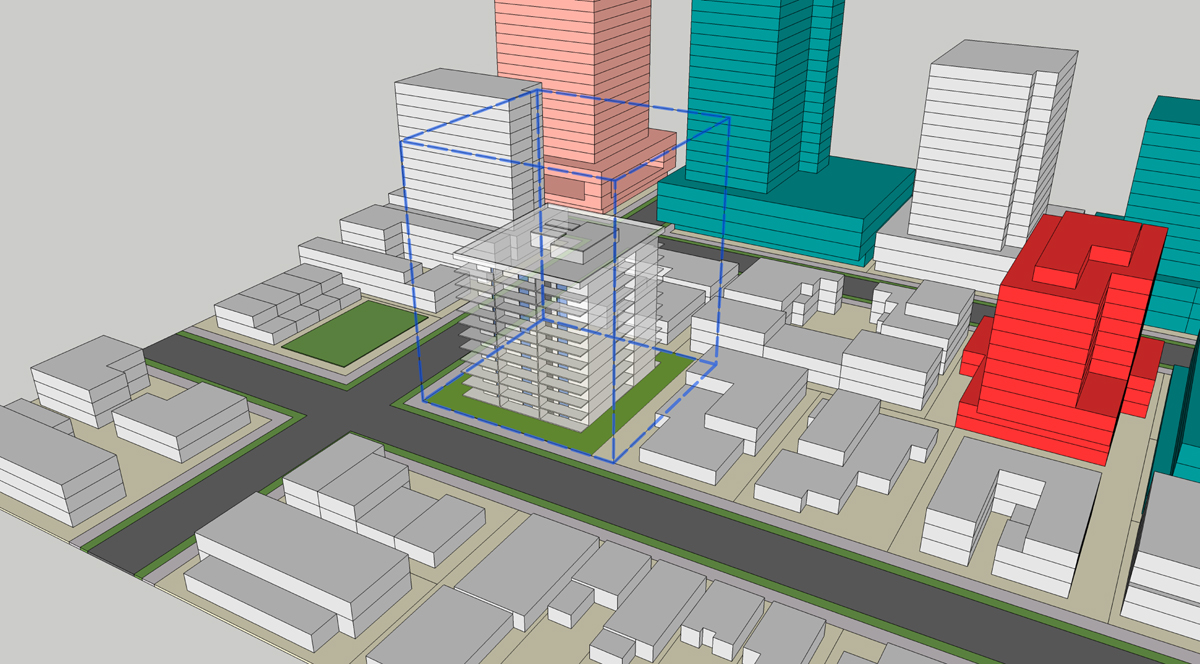
If there is a specific site where a future development is planned, AKL FlowDesigner can be used to identify the likely amount of available wind resource to the proposed subject site allowing architects and designers to respond to the information and increase design efficiency. For the purposes of this example, the below area has been chosen.
After defining a ‘region’ around the subject site, a graph can be generated showing the volume percentage of each wind speed measured within the region. By comparing multiple graphs from different development scenarios, the true impact of contextual development on a single future development site can be understood. One of the more important measures identified in the graph is the ‘average wind speed’ which occurs inside the region.
The defined Region can also provide insights into where the breezes come from and where they travel after leaving the area. This can be visualised by generating ‘Streamlines’ which also show the relative speed of the incoming and outgoing breezes. Any example of this is shown below for the subject site.
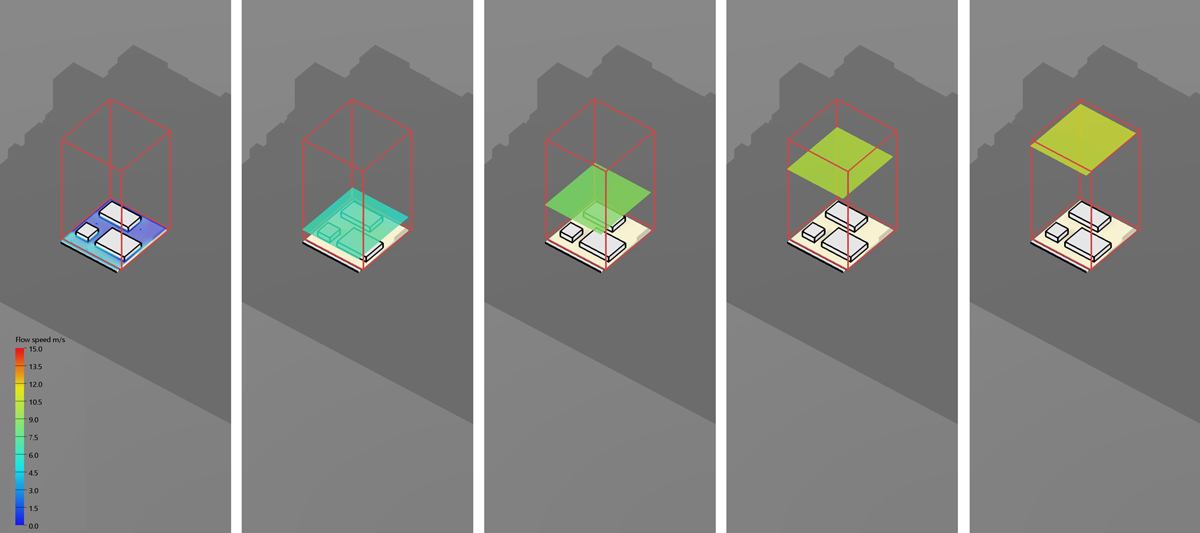
Slices can also be cropped to within areas of interest including Regions to show how the wind speeds occur at different elevations as shown below. The example seen here looks at horizontal slices be these can be aligned to any edge of the selected region.
Whilst any development within the subject area will likely have an effect on the entire system of available wind resources, it is suggested that continued monitoring and analysis of proposed built form will allow for comprehensive decisions to be made in relation to planning controls and the architectural design of future structures.
It should be noted that this article does not aim to look at the amount of radiant heat absorbed by each feature, its transfer between elements or how breezes can reduce heat load with an urban context or individual building. A model with greater details is required to analyse these matters such as this one which will be detailed in Article 2.
Article 2 - 'High Rise and Apartments' focus on using the information gathered during the urban context assessment to inform detailed design decisions for a structure planned in the above images. An example of a built form response with multiple openings and breezeways can be previewed in the below image.
Article 6 - Digital Twins also applies many of the approaches noted in the above article to analysis base information derived from platforms other than Sketchup. Article 6 will examine how GIS information provided at the City of Melbourne - Open Data portal was used to analysis the urban wind resources available in certain areas.
The below video highlights the key procedures and outputs discussed in this article. This video is not intended to be a step by step guide to completing the outlined analysis. Rather it is intended to provide a brief overview of how AKL Flowdesigner works with Sketchup and the speed at which analysis can be completed and the types of outputs generated.